First of all, we have to install Dash on our system. Hit Ctrl+Alt+T on your Ubuntu, it would open up terminal. In order to run Dash applications on our system, we would install 4 to 5 packages using following command:
OR
When you will add -H it would not issue a warning because you would get to the Home variable by using -H in the command. Even if you don’t use it, it would be okay as it would display a warning but Dash would get installed anyway.
Now, you would go on to create a python script. Our first example of code would just display a simple output in our web browser on the server address and port mentioned above. In the example, first 3 lines would be the imports of dash, dash-core-components and dash-html-components respectively. Dash-core-components as dcc means that wherever we want to use dash-core-components we can use ‘dcc’ instead and similarly where we want to use dash-html-components, we can use ‘html’. Dash() is the built in class which holds the default code for Dash applications. ‘app.layout’ represents everything in web UI which means anything you want to display in the browser in Dash application, it has to be written in the operating zone of ‘app.layout’. Following our first simple code example which just displays a simple output:
Code Example#1:
import dash_core_components as dcc
import dash_html_components as html
app = dash.Dash()
app.layout = html.Div('LinuxHint YouTube Hi')
if __name__ == '__main__':
app.run_server(debug=True)
Output:
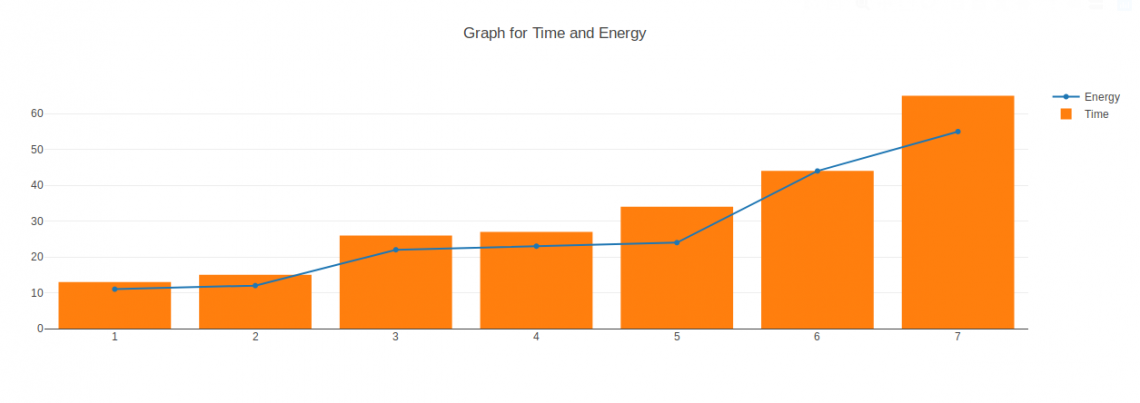
Second example is about creating a graph. We would use ‘dcc’ which essentially means dash-core-components and we would create a graph using it. In our example, we have drawn an example graph of Energy and Time with random values of ‘x’ and ‘y’ by giving a type of ‘line’ to Energy and a type of ‘bar’ to Time. We would do all of that inside a method dcc.Graph() in which we would name our both axis of the graph and set the title of graph as well.
Code Example#2:
import dash_core_components as dcc
import dash_html_components as html
app = dash.Dash()
app.layout = html.Div(children=[
html.Div(children='LinuxHint Youtube Hi'),
dcc.Graph(
id='graphss',
figure={
'data': [
{'x':[1,2,3,4,5,6,7], 'y':[11,12,22,23,24,44,55], 'type':'line', 'name':'Energy'},
{'x':[1,2,3,4,5,6,7], 'y':[13,15,26,27,34,44,65], 'type':'bar', 'name':'Time'},
],
'layout': {
'title': 'Graph for Time and Energy'
}
}
)
])
if __name__ == '__main__':
app.run_server(debug=True)
Output:
Pro Tip: While writing python script, use a python IDE or a smart text editor which indents the code automatically for you. Avoid using simple notepad or text editor for python scripts as indentation of code is an important factor in python while running it.
I will explain this in more details in video form as well.


